JESWIN GEORGE

DATA ANALYST
Download my resume
View My LinkedIn Profile
View My Tableau Public Profile
Test a perceptual phenomenon - Stroop Effect
Background Information
In a Stroop task, participants are presented with a list of words, with each word displayed in a color of ink. The participant’s task is to say out loud the color of the ink in which the word is printed. The task has two conditions: a congruent words condition, and an incongruent words condition. In the congruent words condition, the words being displayed are color words whose names match the colors in which they are printed: for example RED , BLUE . In the incongruent words condition, the words displayed are color words whose names do not match the colors in which they are printed: for example PURPLE , ORANGE . In each case, we measure the time it takes to name the ink colors in equally-sized lists. Each participant will go through and record a time from each condition.
Question 1: Identify variables in the experiment
Independent Variable:
To read all the words displayed which are color words and whose names do not match the colors in which they are printed.
Dependent Variable:
It is the time taken to name the ink colors in equally-sized list as in the congruent words list.
Question 2a: Establish hypotheses
As the idea for hypothesis testing and statistical inference is that using the limited data samples we have to infer the effect of the intervention on the population mean.
Null Hypothesis H0:
The population average time taken to read the set of congruent words μc and population average time taken to read the set of incongruent words μi are the same.
So for H0 after doing the statistical test on the sample sets we must observe that that the sample mean must not fall in the critical region for the assumed alpha.
Mathematically it can be written as:
H0 : μc = μi
H0 : μc - μi = 0
Alternate Hypothesis Ha:
The population average time taken to read the set of congruent words μc and the population average time taken to read the set of incongruent words are different. And according to stroop effect, time taken will be more to read the incongruent words.
So for Ha after doing the statistical test on the sample sets we must observe that that the sample mean must fall in the critical region for the assumed alpha .
Mathematically it can be written as:
Ha : μc != μi
where,
μc - population mean of time taken to read the congruent words list.
μi - population mean of time taken to read the incongruent words list.
Question 2b: Establish a statistical test
For analysing the given dependent, paired samples, I will be using t-test because for each of the two samples same person has been tested twice, first using the congruent words list and then using the incongruent words list.
The assumptions for t-Test for Dependent Means are:
- Samples or sets of data used to produce the difference scores are linked in the population through repeated measurement, natural association, or matching.
- Scores are normally distributed in the population; difference scores are normally distributed.
- Random sampling from a defined population.
Question 3: Report descriptive statistics
Variables used :
nc – sample size of the congruent words list.
ni – sample size of the incongruent words list.
𝑥C – Sample average of the time taken to read the congruent words list.
𝑥I – sample average of the time taken to read the incongruent words list.
SC – Standard deviation of the time taken to read the congruent words list.
SI - Standard deviation of the time taken to read the incongruent words list.
nc = 24
ni = 24
Measure of centrality:
Mean of the two given samples.
x̄c = 14.05 seconds
x̄i = 22.02 seconds
Measure of variability:
Standard deviation of the two given samples.
SC = 3.56
SI = 4.79
Question 4: Plot the data
To visualize the given sample and to draw comparisons I have used scatterplot and a line graph.
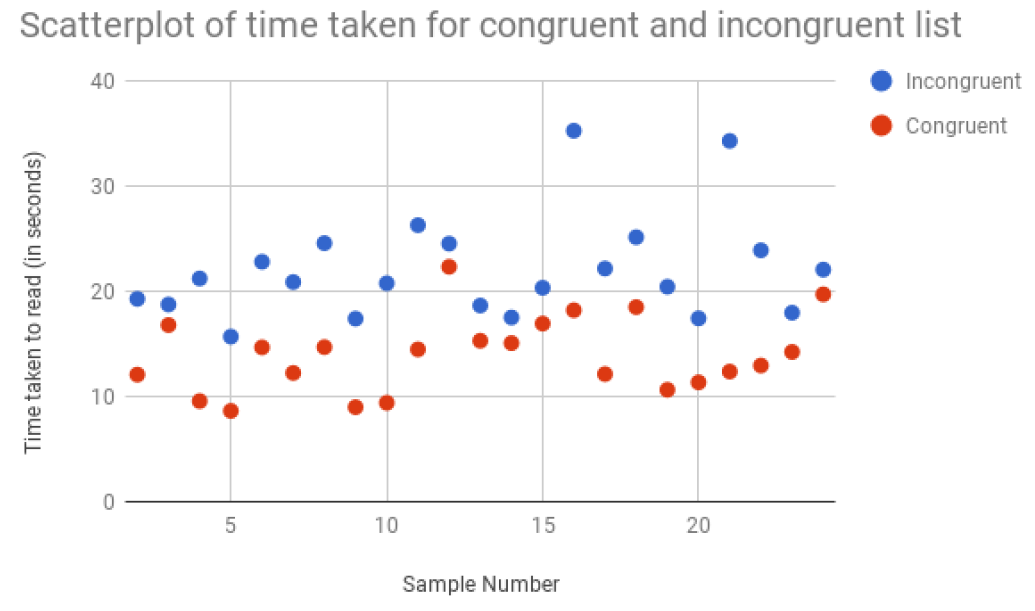
The above figure shows the scatterplot of the sample values of time taken to read the congruent and incongruent words list. It can be observed that majority of points belonging to the incongruent lists have more taken as compared to that of the congruent words list.
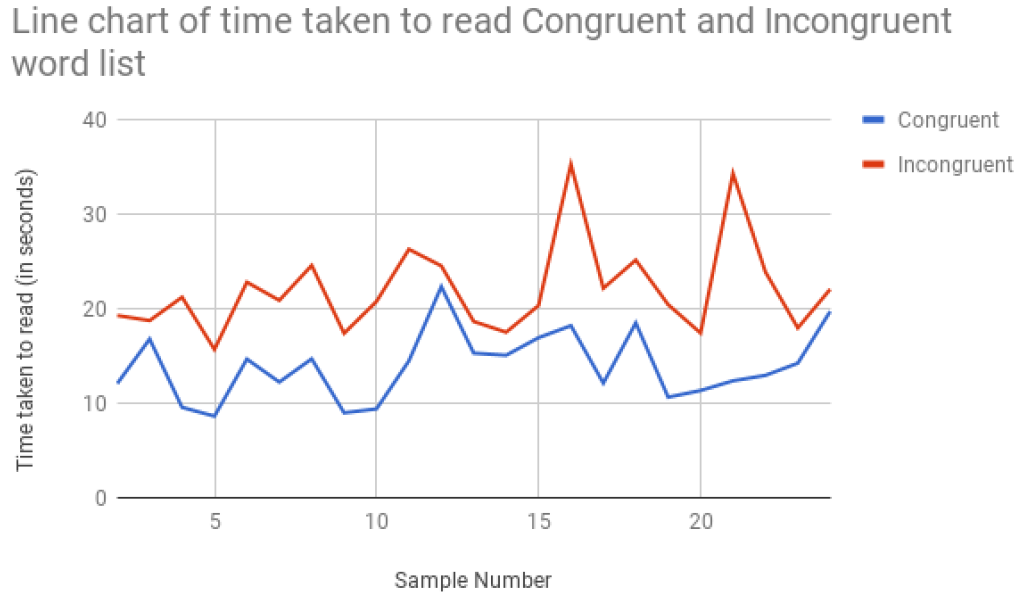
The above figure shows the line chart of the sample values of time taken to read the congruent and incongruent words list. It can be observed that majority of points belonging to the incongruent lists have more taken as compared to that of the congruent words list.
Question 5: Perform the statistical test and interpret your results
From above:
nc = ni = 24
Mean difference x̄d = -7.96 seconds
Standard deviation of the differences Sd = 4.76 seconds
Degrees of freedom df = 24-1 = 23
Standard error = SE = 0.97
t-statistic = -8.19
Taking, α = .05 and df = 23.
t-critical = ± 2.069 (2-tailed)
The 2-tailed p-value is less than .0001.
And the result is statistically significant.
As t-statistic falls in the critical region so the decision is to reject the null. So it can be inferred that the time taken to read the congruent list is less as compared to the time taken to the time taken to read the incongruent list.
Question 6: Digging deeper and extending the investigation
The Stroop Effect is the interference in mind due to two conflicting pieces of information the word and the color of the word which causes that causes an overlap in cognition. It is also helpful in studying the reaction time of a person. So if an experiment is performed based on the above effect the reaction time of a found to be more. Many variations can be performed to this test.