JESWIN GEORGE

DATA ANALYST
Download my resume
View My LinkedIn Profile
View My Tableau Public Profile
Making small multiple charts in tableau
Small multiples are a group of charts or graphs that share the same axes and scales, which allows the user to compare trends across dimensions in a single view. They have been praised for their ability to provide a great deal of context, reducing the need for end users to ask the dreaded, ….So what?.
While small multiples is still a ‘descriptive’ view, it helps answer the question, “Compared to what?”
Case 1: Comparing a single measure across two different dimensions.
Global superstore orders Data used can be downloaded from here
Here comparing measure Sales across two dimensions - Market and Segment.
Steps:
-
Place one dimension Market on the columns shelf and other dimension Segment on the Rows shelf along with the aggregation
SUM(Sales).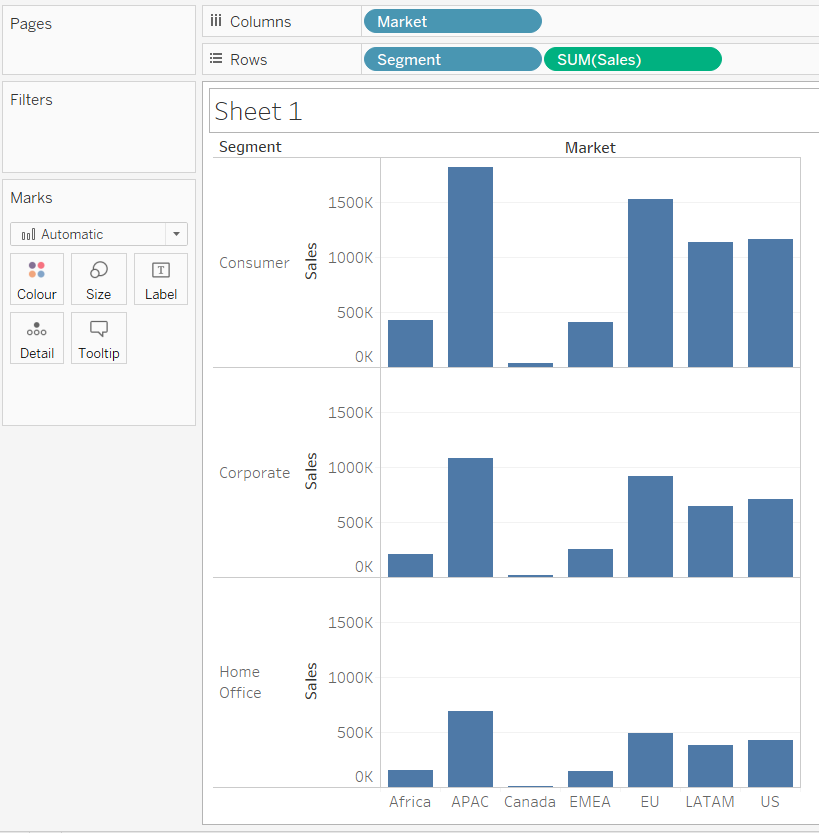 Small multiples may be a series of bar charts, but we still need to add an element of time to trend the ‘Sales’ measure.
 -
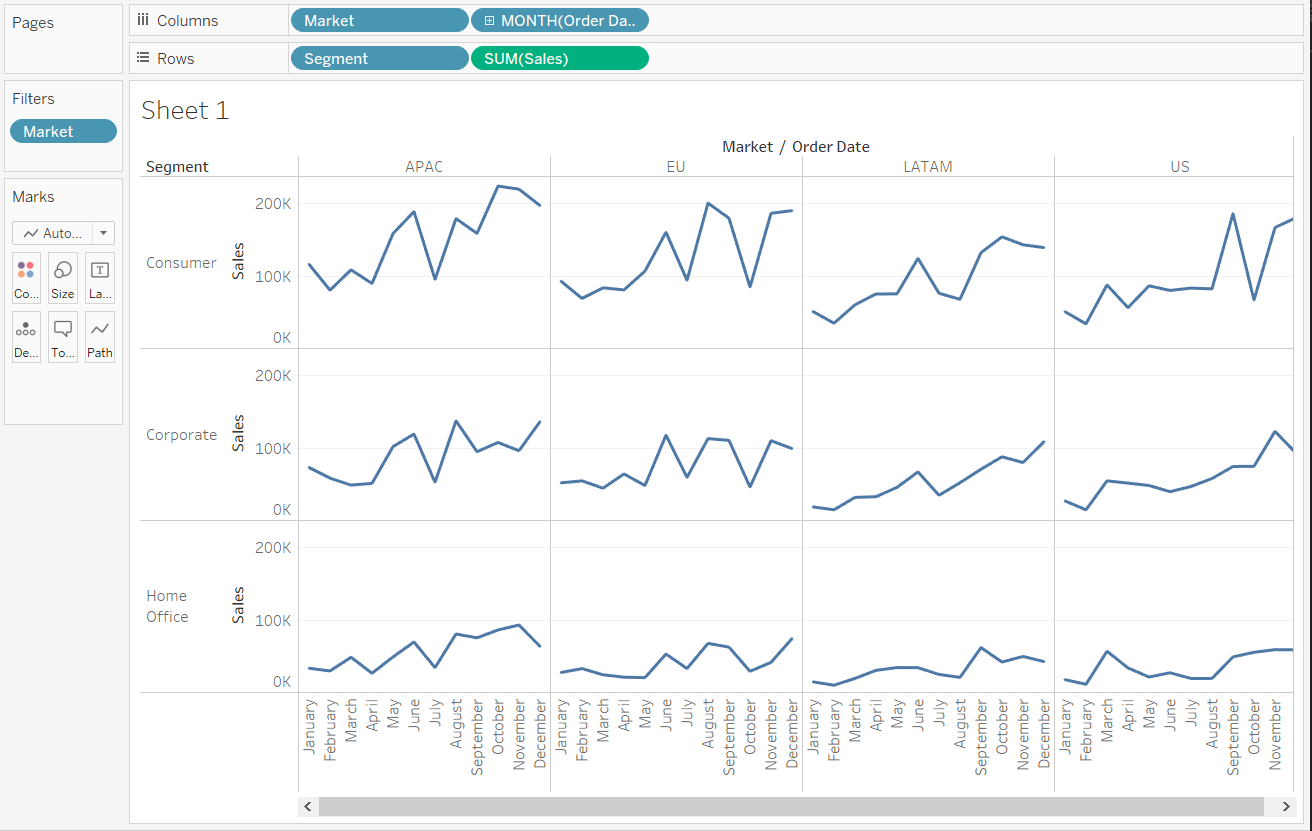
For ease, here I will be filtering and using only four markets - EU, APAC, US and LATAM. Now place a date field Order Date on the ‘Columns’ shelf.
It can be used to evaluate the seasonality of sales to answer question such as, “Is there a certain month that I can expect a spike in sales?” Then right click and change YEAR(Order Date) to MONTH(Order Date). We will obtain the Dates as monthly data, now right click on the Dates label on the x-axis and choose Rotate Label to rotate and view months clearly.
-
Now do the necessary formatting to finalize a view.
- Hid the field labels for columns by right-clicking on “Market / Order Date”.
- Hid the field labels for rows by right-clicking on “Customer Segment”.
- Right click on the row axis and click on Sales and uncheck Show Header.
- To keep the view as clean as possible, its better to provide context in the form of a title, and would typically provide additional information in the tooltips that appear when an end user hovers over different data points.
The resulting image:
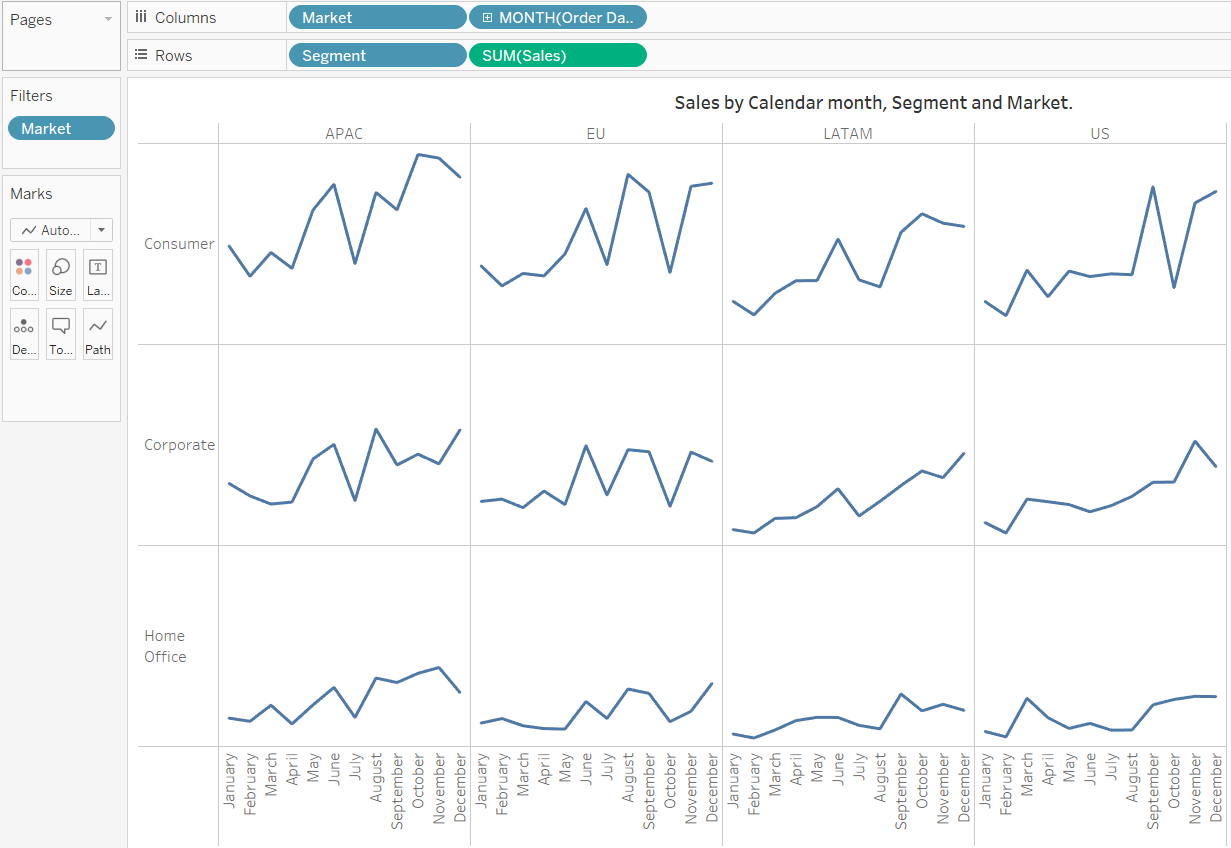
Link to the small multiple image