JESWIN GEORGE

DATA ANALYST
Download my resume
View My LinkedIn Profile
View My Tableau Public Profile
Bullet graph
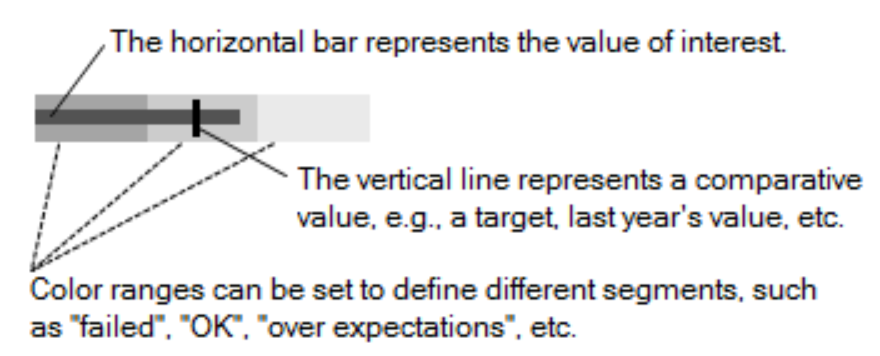
Bullet graphs are used to compare one value, represented by a horizontal bar, to another value, represented by a vertical line, and relate those to qualitative ranges.
A bullet graph is a very powerful way to compare data against historical performance or pre-assigned thresholds. As you’ll see, we can include a lot of information in a small space with this type of chart that is also Tableau’s answer to those looking for a gauge or meter visualization.
Here are the different components of a mark within a bullet graph:
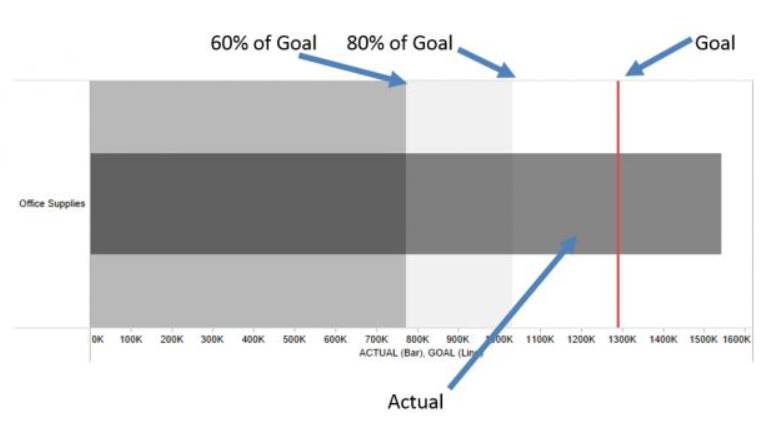
In the image above, the dark gray bar represents actual performance while the red reference line is a goal. The underlying distribution range has been set to identify 60% and 80% goal completion. The example above shows that the current revenue is well above the reference line goal, indicating that this year’s performance was stronger than the previous one.
Steps:
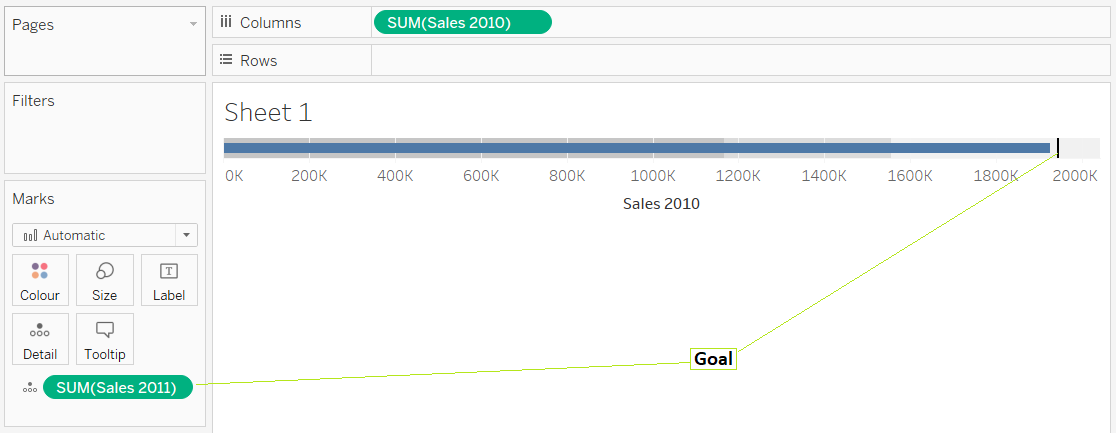
Lets try to compare the total sales made during the year 2010 and 2011.
- Create 2 measures to get the total sales made during the years 2010 and 2011.
Create calculated field - Sales 2010
IF YEAR([Order Date])=2010
THEN [Sales] ELSE 0 END
Create calculated field - Sales 2011
IF YEAR([Order Date])=2011 THEN [Sales] ELSE 0 END - Then hold shift and select the new measures Sales 2010 and Sales 2011 and from the Show Me section select Bullet Graph. And the resultant image is:
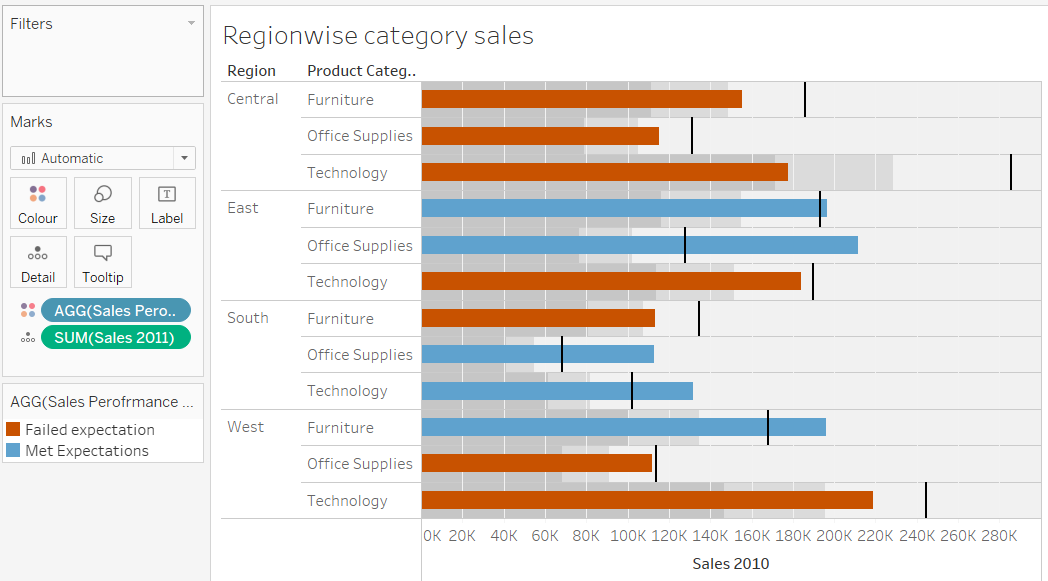
- We can increase granularity by adding 2 more dimensions to it.
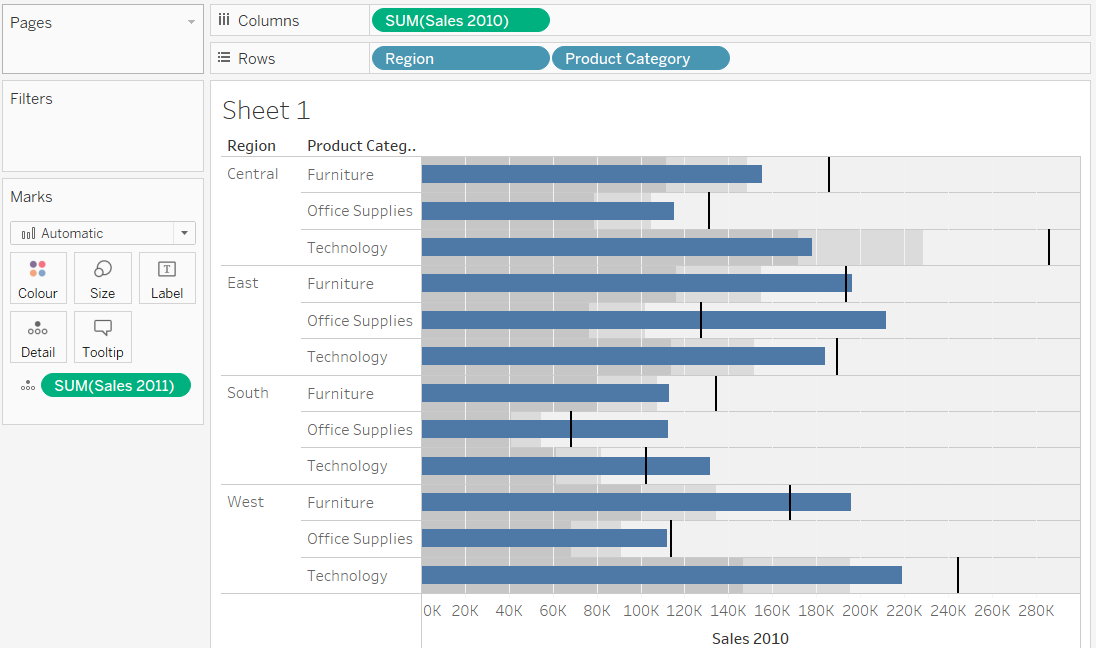
- Now can create a calculated field to see if the Sales made in 2010 were greater than the Sales in 2011 for the given dimensions. Create calculated field - Sales Performace 2010:
IF SUM([Sales 2010]) > SUM([Sales 2011])
THEN 'Met Expectations' ELSE 'Failed expectation' END
Then drag it to colors mark card and we get the following image.
Reference: