JESWIN GEORGE

DATA ANALYST
Download my resume
View My LinkedIn Profile
View My Tableau Public Profile
I tried to implement the Tableau visualizations using LOD expressions made in the blog .
Important Tip: Measures are aggregated when added to the view. Adding a dimension will increase the granularity of the view.
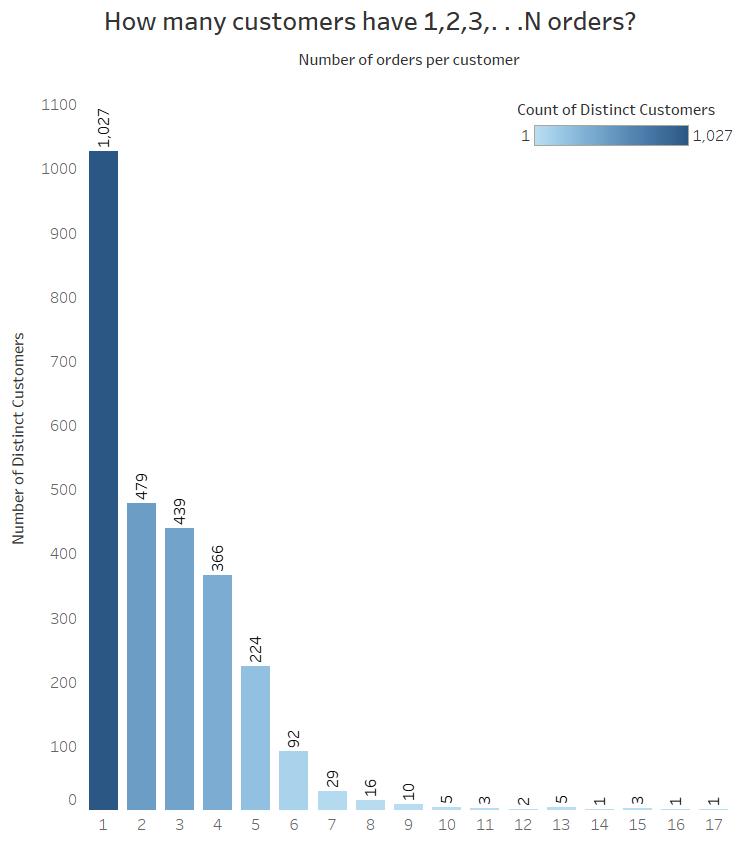
1. Customer order frequency
Number of customers who ordered one order, two orders, three others and four others. To create a histogram of the number of customers who purchased 1,2,3,…N times.
Steps:
- Create a calculated field Number of distinct customers:
COUNTD([Customer ID])and drag it to Rows shelf and set Marks card to Bar type. - Create a calculated field Number of orders per customer:
{ FIXED [Customer ID]: COUNTD([Order ID])}and convert this to dimension. - Then drag the calculated field Number of orders per customer to the Column shelf and also drag calculated field Number of distinct customers to the color and Label Marks card. Then we get a histogram of the number of customers who purchased 1,2,3,…N times.
- Then do the necessary formatting, title and tooltip modififcation.
Link to the created visualisation
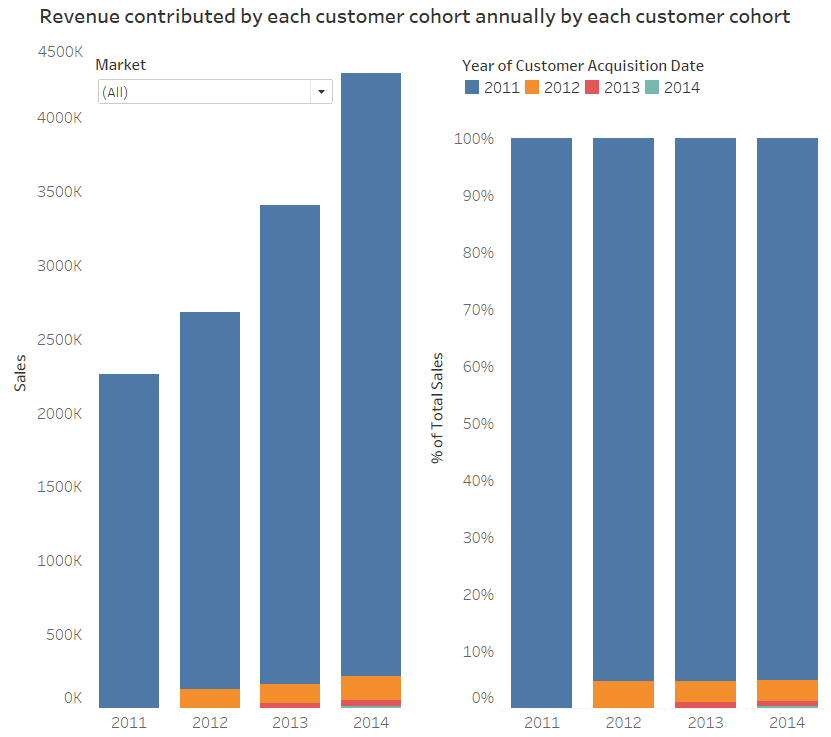
2. Cohort analysis
To compare a group (cohort) of customers based on their first year of order date and check their contribution to the overall Sales.
Important reference: Tableau Order of expression evaluation
Steps:
- Create a calculated field Customer Acquisition Date :
{ FIXED [Customer ID]: MIN([Order Date])}and it will be a dimension. - Drag Sales to the Rows Shelf and set Marks card to Bar type and we get a bar graph with SUM(Sales).
- Now to drag the calculated field Customer Acquisition Date to color in the marks card and we get a stacked bar graph for each year in consideration showing the customer cohort year.
- Drag Market to filters card to get the visualization for each market.
- Now duplicate the sheet and to get percentage of sales for each year do a table calculation
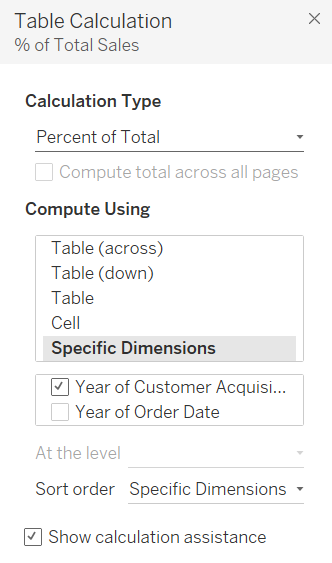
- Now do the formatting, labels and create dashboard.
- Link to the created visualization.
3. Daily profit KPI
To know the number of profitable days achieved each month or year, especially if we were curious about seasonal effects. The following view shows how LOD Expressions allow us to easily create bins on aggregated data such as profit per day, while the underlying data is recorded at a transactional level.
Here we will set KPIS as :
- Profit per day > 2000 => Highly Profitable
- Profit per day > 0 => Profitable
- Profit per day < 0 => Unprofitable
Steps:
- Need to calculate profit each day using calculated field (and Fixed LOD) Profit per day:
{FIXED [Order Date] : SUM([Profit])}. This helps us to easily bin the days in a secondary calculation. - Create a calculated field Daily Profit KPI :
IF [Profit per day]>2000 THEN "Highly Profitable" ELSEIF [Profit per day]>0 THEN "Profitable" ELSE 'Unprofitable' END - Now drag Order Date to columns shelf and keep YEAR(Order Date) and MONTH(Order Date).
- Drag calculated field Daily Profit KPI to Rows shelf.
- Create a calculated field Count of Distinct order dates:
COUNTD([Order Date])and drag it to Rows shelf. - Select Mark type to Area.
- Drag calculated field Daily Profit KPI to color Marks card.
- Link to the created visualization.

4. Percent of total
Here we will try to find the percentage of sales contributed by each country and also use filter Market.
Steps:
-
To calculate the total sale use fixed LOD. Create a calculated field Total sales:
{SUM([Sales])}. This will create a single column with constant value of total sales.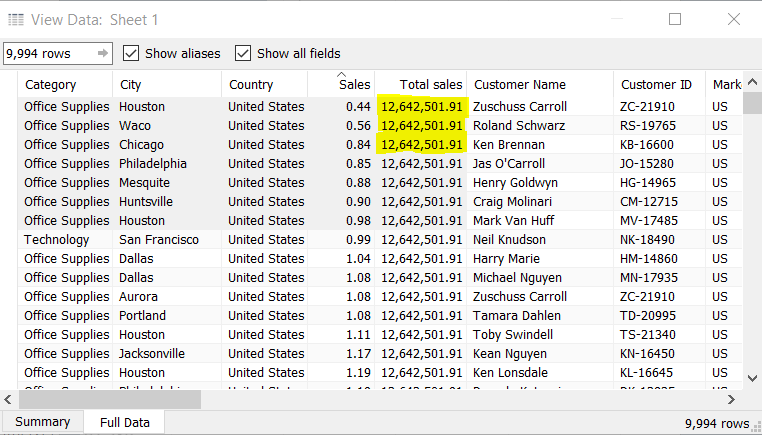
-
To find the overall sale %ge create calculated field Percent of total:
SUM([Sales])/[Total sales]. This will create a single column which has %ge sale for that row.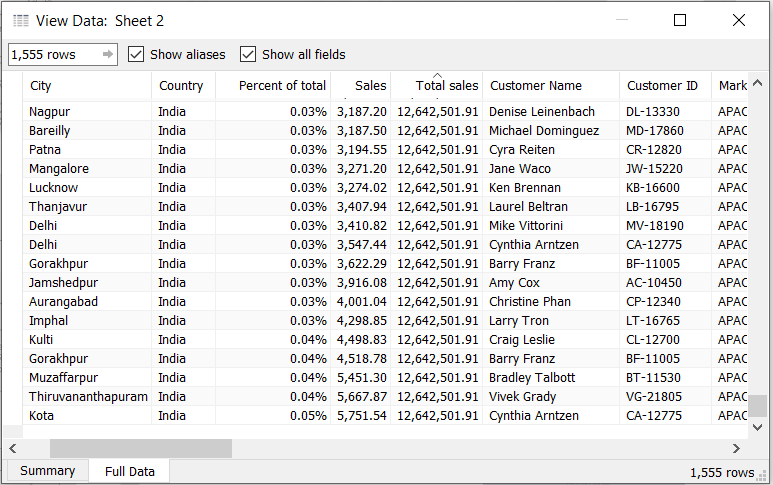
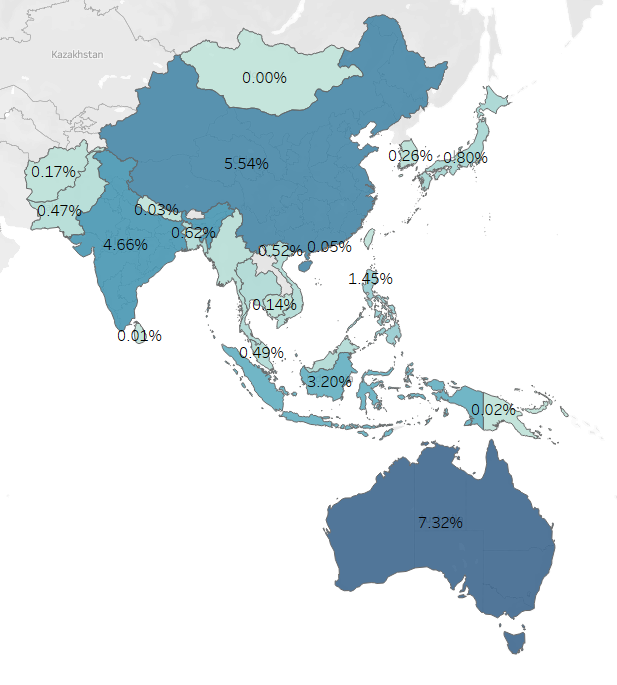
- Now double click on the country to create a map.
- Drag claculated field Percent of total to color and label marks card.
- Add Market as quick filer which aids in focussing on a particular Market.
- APAC Market view with their percentage of total sales value.
Link to the created visualization.
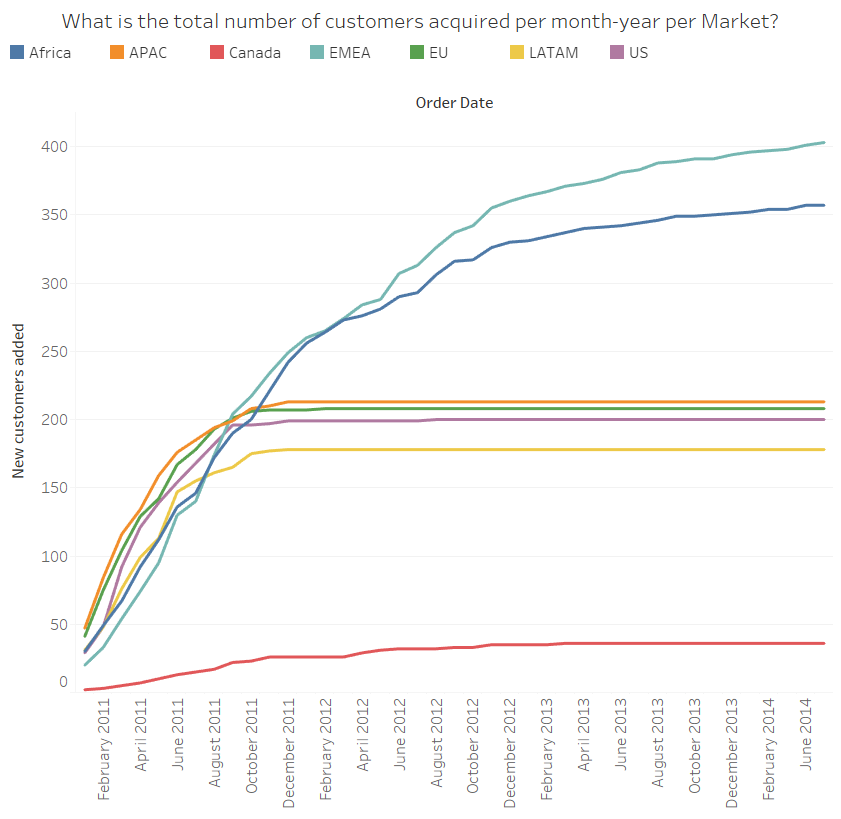
5. New customer acquisition
What is the daily trend of total customer acquisition by market? Finding the trend in this data will help us understand how well the regional marketing and sales organizations are doing at generating new business. The steeper the line, the better the acquisition trend. As a line flattens out, some action must be taken to increase lead flow.
An LOD Expression ensures that repeat customers are not miscounted as new customers, as data must be evaluated at the customer level even though it is displayed visually by market and day.
-
Create a calulated field Customer Joining Date:
{ FIXED [Customer ID]: MIN([Order Date])}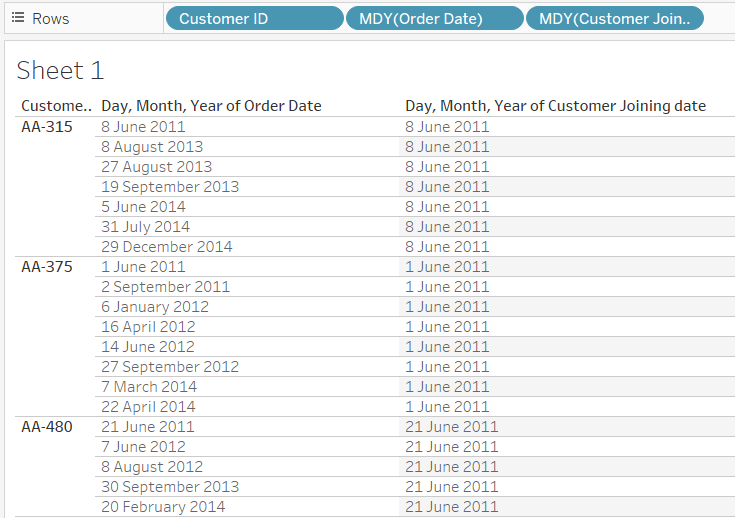
-
Now created another calculated field to see for a given order date the customer who ordered was an Existing or a New customer. Named the calculated filed is New Or Existing:
IIF([Customer Joining date]=[Order Date], "New", "Existing")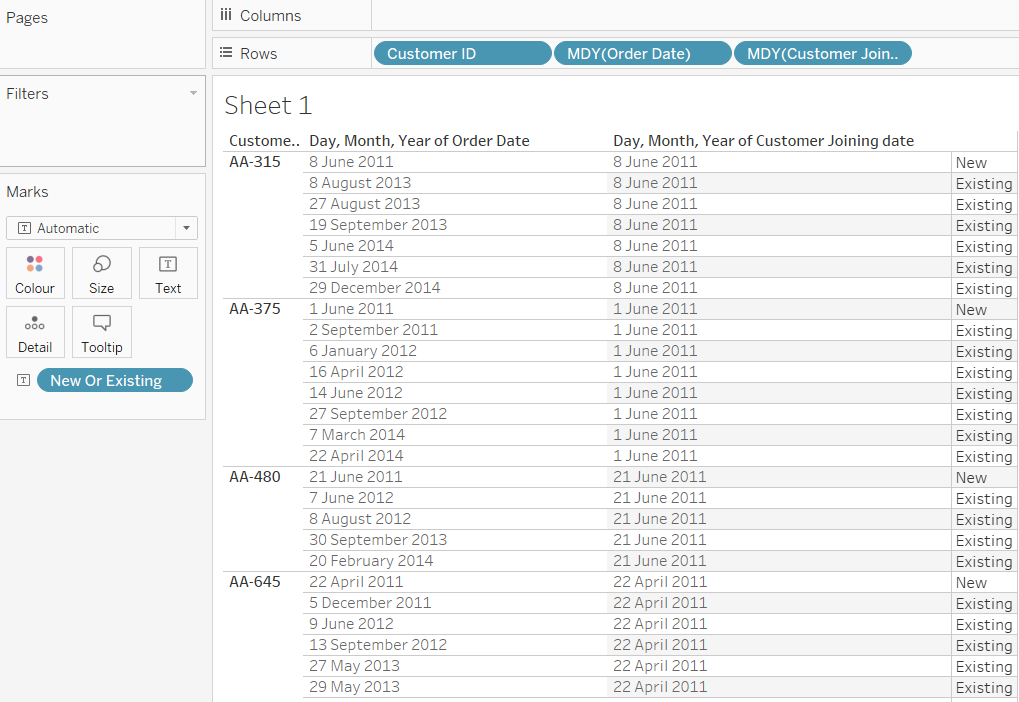
- Create a 3rd calculated field Count of distinct customers:
COUNTD([Customer ID]) - Now Drag the field Order Date to columns and convert it to (Months/Year) format.
- Drag the calculated field Count of distinct customers to rows and do a quick table calculation of _Running Total__ to see all the new customers added over the Month/years.
- Now drag the calculated filed New Or Existing to filters and select - New.
- Now drag the field Market to colors mark card to see distinct new customers added to each market.
- Now create a dashboard after doing the necessary formatting.
Link to the created visualization.
6. Comparative sales analysis
It’s relatively straightforward to find the difference from average, but what if you wanted to find the difference from a selected category? First, you must isolate the sales of the selected category. Then an EXCLUDE Expression is needed to repeat that value across all other categories. It is then easy to take the difference of each category’s sales from the rest.
Steps:
-
Create a parameter __ Select a Sub-Category__

Worksheet after adding Sub-category and SUM(Sales) to it and after sorting in descending order.

-
Need to isolate the sales of sub-category we are interested in this can be done with the help of IF statement and with the help of Parameters to make it more dynamic. So create a calculated field Selected Sales:
IF [Sub-Category]=[Select  a Sub-Category]
THEN [Sales] ELSE 0 END
Now right click on the parameter made earlier and select Show Parameter control.

-
An LOD expression that excludes the category from grouping the sum of selected sales will total the selected sales across all rows. This will make it easy to compare the sales of each category to the selected category. So create a calculated field Sales of Selected Category :
{EXCLUDE [Sub-Category]: SUM([Selected Sales])}. -
Now create another calculated field Difference from selected:
SUM([Sales]) - SUM([Sales of selected category])
Now do the following changes in workseet to see difference in sales of each sub-category side by side.

- Now do the necessary formatting and modify tooltips as required.

Link to the created visualization